In this tutorial, we are going to cover what Customer Experience (CX) is, why it matters for your business, and how you can use it to achieve your Objectives and Key Results (OKRs).
We’ll go through a step-by-step process and you are going to learn how to create professional CX surveys with the help of the free, powerful, and easy-to-use WordPress Plugin Forminator.
You can use the table of contents below to jump ahead or continue reading:
Part I
- What are OKRs
- What is Customer Experience (CX)?
- How to use customer feedback to improve your CX metrics
- KPI’s for Customer Experience (CX)
Part II
- How to create CX surveys with Forminator step by step
- How to manually export data
- Downloads
- Data manipulation
Let’s begin with what OKRs are and why they are so important for your business (and maybe your client’s business if you are a freelancer or an agency)
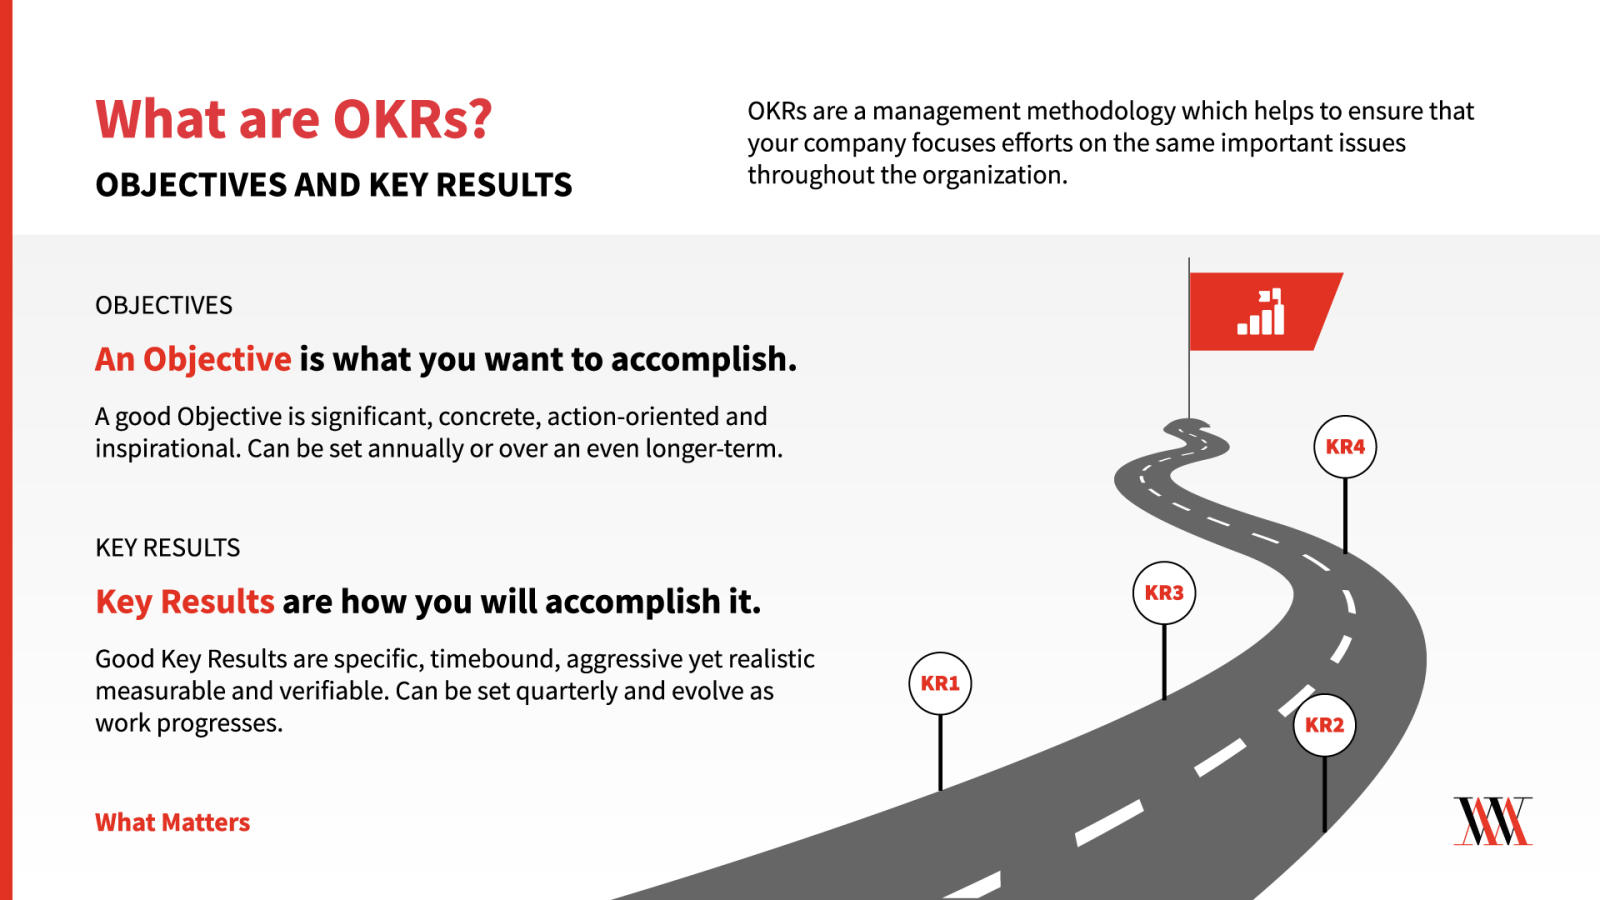
What are OKRs
Objectives and Key Results (OKRs) are a way to set goals and measure progress.
The first question I had when I came across the concept of OKRs, was ‘what’s the difference between OKRs and KPIs (Key Performance Indicators)?
It turns out that I wasn’t the only one having that question in mind. There is an abundance of similar questions when you google it.
OKRs constitute a strategic framework.
KPIs are measurements within such a framework.
Jeff Bezos’ long-term strategy for Amazon, included becoming the world’s most customer-centric company.
This is obvious if you read his first letter to shareholders back in 1997.
In it, he calls it customer obsession.
This Amazon strategy sounds like a great example of an OKR based on Customer Experience (CX).
What is Customer Experience (CX)?
Customer Experience is how your customers feel about their experience with your business or brand. It is their perception as well as their emotions and it is related to the whole experience.
In essence, CX covers every single touchpoint and interaction with your company. Anything they experience throughout the time they spend with your brand.
What is considered a good customer experience?
In the heart of a great customer experience lies the ability to empathize with the customer.
What is considered a bad customer experience?
Does the visitor of your website feel like she’s getting attacked when she first lands on your homepage?
Cookie consent, push notifications, annoying popups…
While cookie consent may be unavoidable, excess use of other notifications, offers to subscribe, freebies, clickbait, and even discounts for first-time visitors are an example of bad customer experience (and user experience).
UX (user experience) can be seen as part of CX (customer experience).
How long does it take to respond to a ticket or a chat message? People expect to get an answer quickly. Unfortunately, they have no patience.
An example of a bad customer experience is long wait times.
If they don’t love your brand, they will just go somewhere else where they feel they are getting treated as they expect.
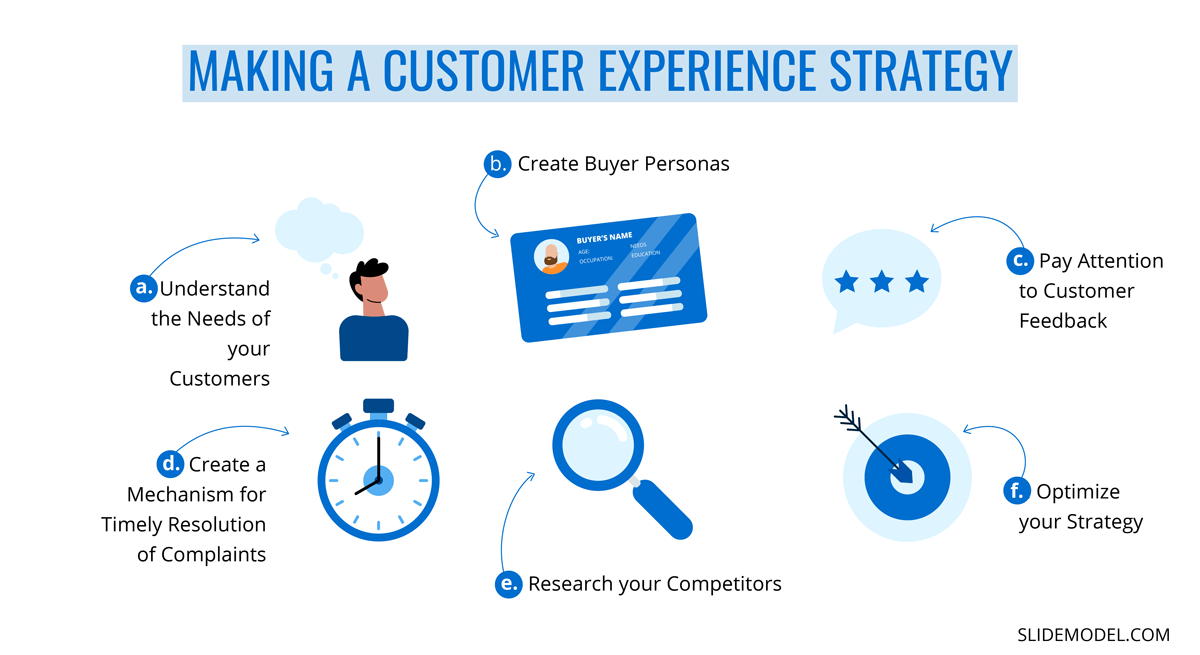
Do you (and your team/employees) really understand their needs?
Do you understand the reasons behind their behavior?
Do you use bots instead of humans? This is likely a bad customer experience. People want answers, they want them quick but they want to talk to humans.
Bots don’t have emotions. People want to feel. We are primarily emotional creatures, especially when we are deciding on buying something.
Are you and your team always kind to the customers? Even if they are angry and rude?
Angry and rude responses guarantee a lost customer and most likely a bad review.
Excessive communication is also an example of bad CX.
Emails without being asked first if they want to be communicated for specific topics, lack of segmentation, and personalization are common mistakes and examples of bad CX.
Let them raise their hand. Respect them and they will respect you back.
Adding/allowing ads in your educational YouTube videos is another example of a bad CX.
How to use customer feedback to improve your CX metrics
The best way to utilize your customer’s feedback is through the industry standard CX surveys.
The best way to strategize this, is to utilize several different CX metrics that can be used individually or together to get the best possible picture of customer experience in our business.
This brings us to the KPIs (Key Performance Indicators) for CX (Customer Experience).
KPIs for CX
The following KPIs are the most popular but certainly not all of the CX KPIs available at your disposal.
Net Promoter Score® (NPS®)
Net Promoter Score® is a customer experience score that is simple, easy, and all-powerful.
We calculate it by first asking our customers a simple closed-ended question:
“On a scale from 0 to 10, how likely are you to recommend this product/company to a friend or colleague?”.
Then we group the responses as follows:
- Promoters (score 9-10): they are loyal enthusiasts who will keep buying and referring others, helping our company grow.
- Passives (score 7-8): they are satisfied but unenthusiastic customers who are ready to leave when they find an appealing competitive offer.
- Detractors (score 0-6): they are unhappy customers who can damage our brand through negative reviews and word-of-mouth. They can provide great feedback however on areas that are blind spots for the insiders.
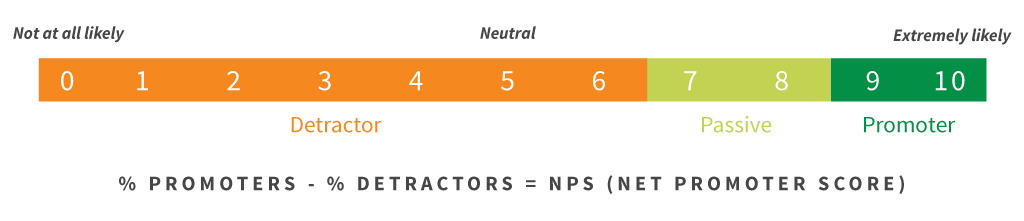
Net Promoter Score is calculated by subtracting the percentage of Detractors from the percentage of Promoters.
It can range from as low as -100 (unlikely though, this would mean that every single customer is a Detractor) to a high of 100 (dream scenario, where every customer is a Promoter).
Below is the NPS® survey I created using Forminator from wpdev team. It is a live example and you may test it if you want.
Later in this article, you can find a step-by-step tutorial where I show you exactly how I created all of the forms below and I share the template with you if you want to import them and save some time.
In all the forms below, I have created some follow-up questions with conditional logic – depending on the score you give, you receive a slightly different answer – and at the end, I offer as a ‘thank you for your feedback’, a 10% off Coupon code.
It’s just for demonstration purposes, you may want to say or offer something else and/or redirect the user to another page.
Forminator allows you to do all that as well as to design and apply more sophisticated ideas with ease.
Net Promoter Score (NPS) Survey
Customer Effort Score (CES)
Customer Effort Score measures the experience a customer had during an interaction with our business/brand, in terms of how ‘difficult’ or ‘easy’ it was for the customer.
An example related to customer support can be how easy it was to contact support, and how easy or difficult was to have the issue resolved.
An example related to a purchase can be how easy it was to find the product, to navigate the website, or the checkout process.
An example related to a service can be how easy or difficult was to understand the scope of the project, the quotation, or the proposal.
An example related to a SAAS company can be how easy the customer onboarding process has been for them.

A typical question of a CES survey for a customer service related interaction, would be something like this: ‘How easy was it to get your issue resolved today?’ with a rating on a scale from 1 (very difficult) to 5 or sometimes 7 (very easy).
Here’s an example of a CES survey we’ll be creating in a while with Forminator.
Try it out and check how the next question changes based on your answer.
With a rating of 4 and 5, you get another answer than the one you get with a rating of 1-3.
Customer Effort Score (CES) Survey
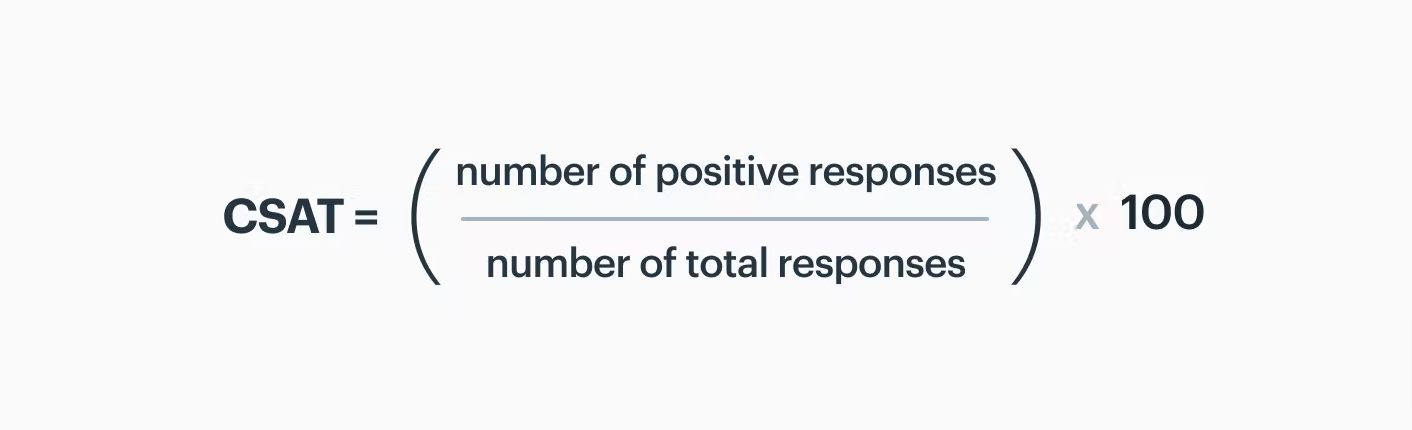
Customer Satisfaction Score (CSAT)
CSAT is measured by one simple question:
‘How would you rate your overall satisfaction with the [product/service/support/onboarding] you received?’
And we use the 1 to 5 scale like this:
1 – Very unsatisfied
2 – Unsatisfied
3 – Neutral
4 – Satisfied
5 – Very satisfied
To calculate CSAT (as a percentage) we simply divide the positive responses (4-5) by the number of total survey responses and multiple by 100:
CSAT = (Number of satisfied customers (4-5) / Number of survey responses) x 100 = % of Satisfied Customers
Here’s an example of a CSAT survey we’ll be creating in a while with Forminator.
In this example, we have included two more follow-up questions. You may or may not want to do that. In any case, follow-up questions are not required.
Try it out and check how the next question changes based on your answer.
Customer Satisfaction Score (CSAT) Survey
Time To Resolution (TTR)
Time to Resolution (TTR) is a customer support metric and it measures the average amount of time between the beginning of a customer interaction and when that interaction is marked as “resolved.”
A Time to Resolution (TTR) survey offers two key benefits:
- You can understand how effective your customer support channels are.
- You can identify customers who need help and/or are frustrated and prevent churn.
Here’s an example of a TTR survey we’ll be creating in a while with Forminator.
In this example, we have included one more follow-up question.
Try it out and check how the next question changes based on your answer.
Time To Resolution (TTR) Survey
Our own KPIs
Every business has its unique objectives, values, and culture.
Based on these it has unique metrics and KPIs that can measure success and customer experience.
Examples may include customer health score, referral rate, customer retention, CLV (customer lifetime value), and more.
It is also the overall relationship with a customer. The psychological effects of dealing with a difficult and/or toxic customer are sometimes hard to get measured in numbers, but they are expressed in terms of how they make us feel and for how long.
How to create CX surveys with Forminator step by step
Now that we have the big picture and the WHY behind CX, it’s time to move on to the HOW.
How to create CX surveys with Forminator, a free WordPress plugin
As promised at the beginning of this article, we’ll now go through the process of creating the forms with Forminator step by step, so that you can follow through and create those forms yourself for your business or your customer’s businesses.
The only prerequisite is to have a WordPress installation and the user rights to install new plugins.
But first, we need to plan our work before we start.
Plan before you start
At this point, it’s a good idea to take the time you need to plan for what you are willing to accomplish.
“A man who does not plan long ahead will find trouble at his door.”
Confucius
You may start by answering the following questions:
- What is the objective? What forms are you planning to create?
- What follow-up questions are you going to ask (if any)?
- What conditional logic are you going to apply to the forms/surveys?
- How are you planning to visualize the data?
I often prefer to journal at this point, to allow ideas to emerge. While I understand this is not for everyone, I highly recommend this method if you haven’t tried it yet.
The questions above are a good start to keep you going. Writing gives birth to new ideas that would have no other way to come to life, mainly because of the constant distractions we have around us (our own minds, other people, devices, social media, etc).
Why Forminator
While there are quite a few tools to create CX surveys, I have found that this WordPress plugin is extremely flexible, robust, and does the job exceptionally well.
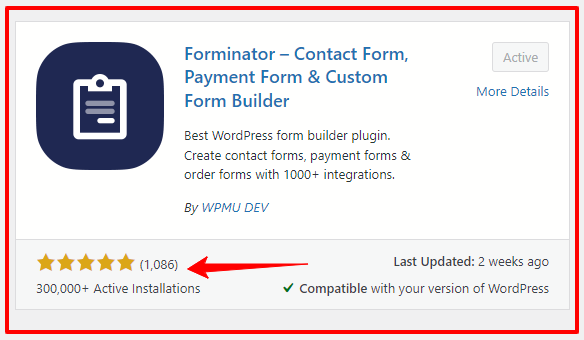
The main reason to use Forminator is the number of installations and 5-star reviews it has as of today.
1000+ 5-star reviews for a WordPress plugin constitute an extraordinary achievement.
Even though it’s a free plugin, it is backed up by the quality of WPMU DEV an experienced and established company that has created an excellent ecosystem of WordPress plugins and Hosting solutions.
You can connect Zapier, allowing you to choose from thousands of other apps to connect and manipulate the data.
I also like the option to integrate with Google Sheets (without Zapier) as well as with some email Marketing platforms like Active Campaign and Mailchimp.
I would love to see more of these integrations for other popular apps like ConvertKit and MailerLite.
You can also utilize your customer database if you already use WordPress and make your forms available only for segments of your users/customers database.
More on that in a future tutorial.
Now it’s time to install and activate the plugin. If you don’t need help with this, you may want to skip to the part where we review the settings of Forminator.
Install and activate the plugin
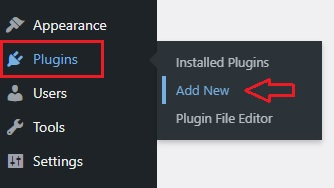
From your WordPress backend, go ahead and click on ‘Plugins’ from the side panel on the left and then select ‘Add New”.
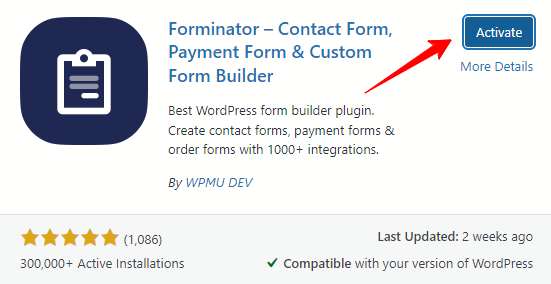
After that go to the top right corner and type forminator to find the plugin from the WordPress Plugin Directory.
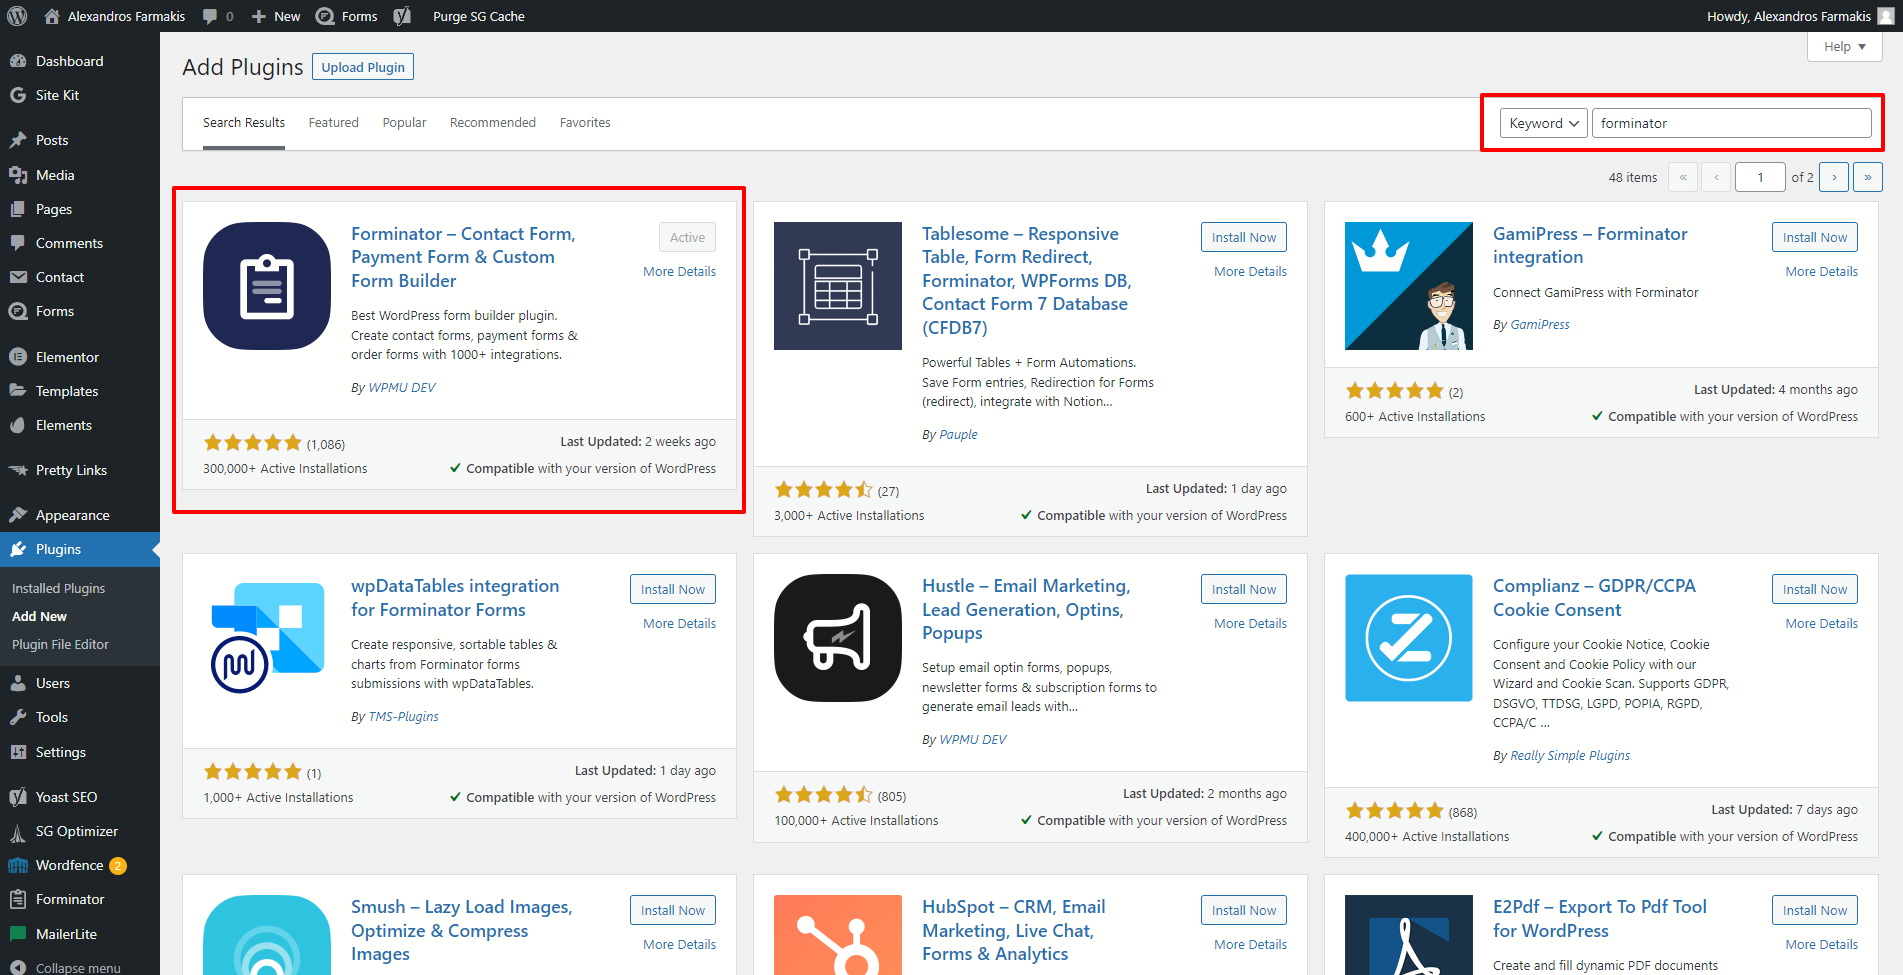
When you locate it as shown in the screenshot above (make sure it’s from WPMY DEV), click on Install Now as shown below:
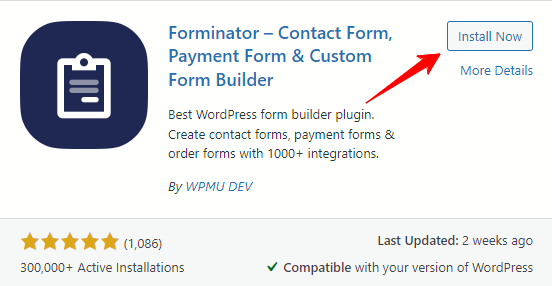
and then when installed, click Activate.
You will then see a message that the plugin is now activated.
Now from the left side panel click on Forminator’s tab and you will see a screen like this one below, which is Forminator’s dashboard:
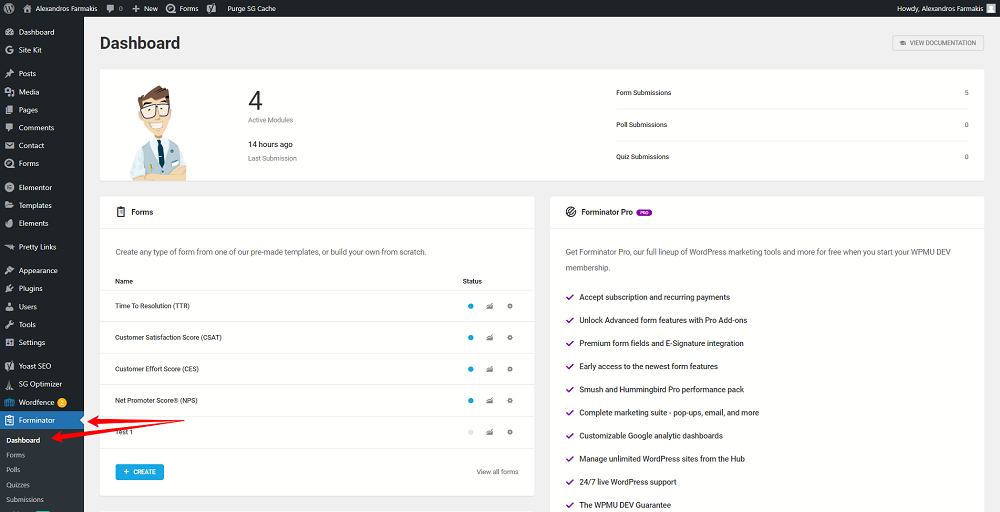
A few things to keep in mind:
Forminator has an extensive and detailed knowledge base and documentation. Every question you have is more than likely addressed and answered there.
From the dashboard, you can always access the documentation by clicking the button in the top right corner.
Let’s review the settings first.
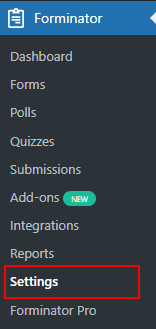
Settings
Before you go any further, I highly recommend you first go through the settings.
In my case and for this example, I didn’t have to change anything.
However, you can start by creating a new preset from the settings so that you have a dedicated design for each one of the groups of forms you’re going to create.
You can do that later as well. The plugin has a smart feature that picks the forms you’ve already created and creates a new preset based on them.
And if you have tweaked the design to match the style of your website like me, then this feature comes in handy.
Hint: You can also duplicate a form and this also keeps the styling you’ve already given to the first form which acts as a template in this case.
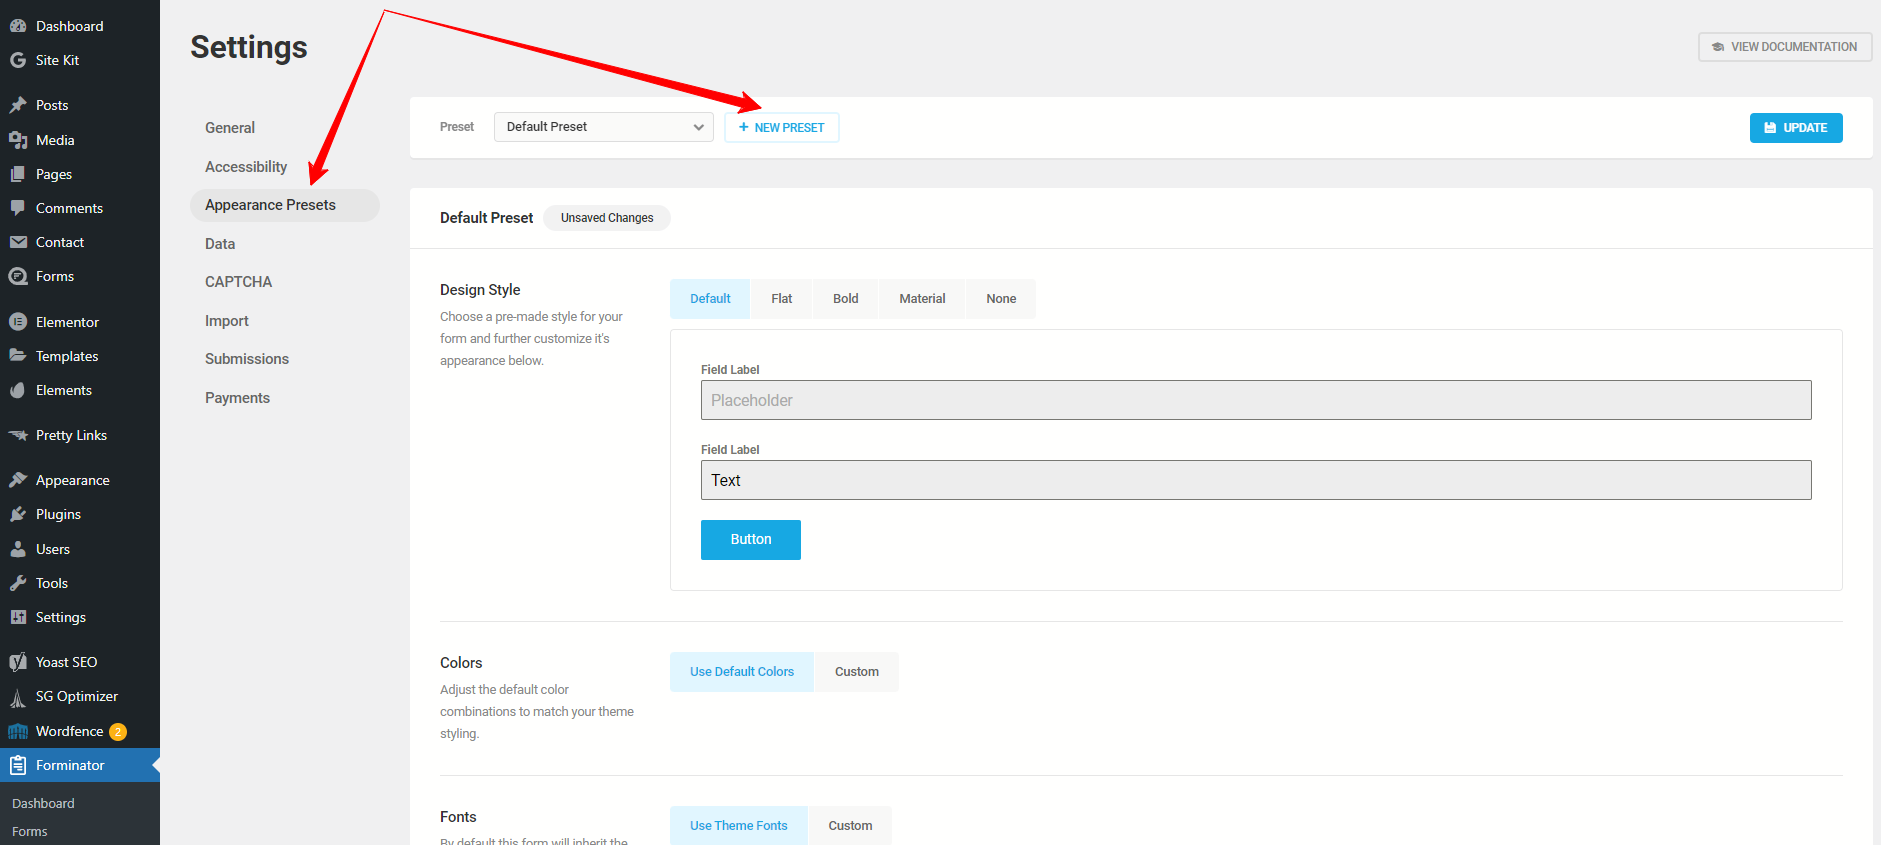
Here’s how to create a new preset:
Click on the button New Preset and shown in the screenshot above.
You will then see a screen like this:
You can now change the fonts, colors, the design style and add some custom CSS if you want.
When you’re done, just click UPDATE on the top right and you’re good to go.
Options (Polls, Quizzes, Forms)
Forminator offers three options. You can create forms, polls, and quizzes.
While I could create a poll for my CX surveys, I decided to use forms cause I felt I had more options.
I had already decided that I would manually export the data for manipulation on a Google Sheet.
I didn’t use the direct integration, but if you decide to do so and need some help to use the integration with Google sheets, this is the place to see how to do it step by step.
If you decide to use the plugin, it is a good idea to test all three types and see which one fits your needs best for each project.
Design
If you haven’t created a new preset in the beginning, now it’s time to customize and style your form.

Start by choosing a design style (flat is the one I used in my CX surveys above) and then choose the proper colors and fonts to match the style of your website.
You can find more about that in their excellent documentation.
Creating your surveys
It’s finally time to create our first survey with Forminator.
We will begin with the NPS (Net Promoter Score) Survey and then we are going to duplicate the form to create the rest.
This will save us time. But before we duplicate any form, we need to make sure that we have finalized the styling of the form and some other details as we’ll see down below.
To create your first survey (NPS), go to the Forms Dashboard and click the blue button ‘Create’ on the top left:

Choose a Blank template and click Continue:
Next, simply give it a name and click Create.
Here’s what you see now:

I have pointed the arrows to the most critical areas of the dashboard.
On the left, there are the tabs with the form settings.
The purple button is where you start creating your form.
On the top right, you have the Save Draft button to save your form, and next to it the Preview button. I use that a lot to see how my form appears and performs in the front end.
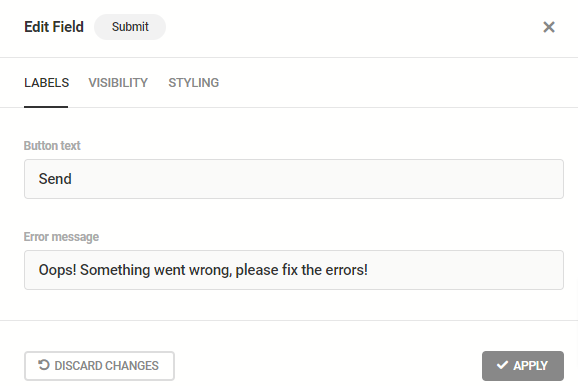
Finally, the bottom left arrow shows the settings for the form completion (Send Message). This is where we change the label (the text ‘Send Message’), the error message they get when something goes wrong, and the visibility (when the field is shown or not depending on the rules / conditional logic you set).
For this specific case, you won’t need to change anything except the label (optional) and the error message (optional).
I have done just that:
Finally, you may add additional CSS classes in the STYLING tab, but again this is out of the scope of this example and you have many options to style the form from the appearance tab (we’ll go through this next).
You can leave the colors and the fonts to default, or you can tweak them to match your website design.
I took the time to do that and my forms use the colors of my website and the fonts are similar to the one I use as default on my website.
In case you are curious, I use Didact Gothic as my basic font and my forms use Comfortaa.
I have also used the Flat Design style from the options that Forminator offers.
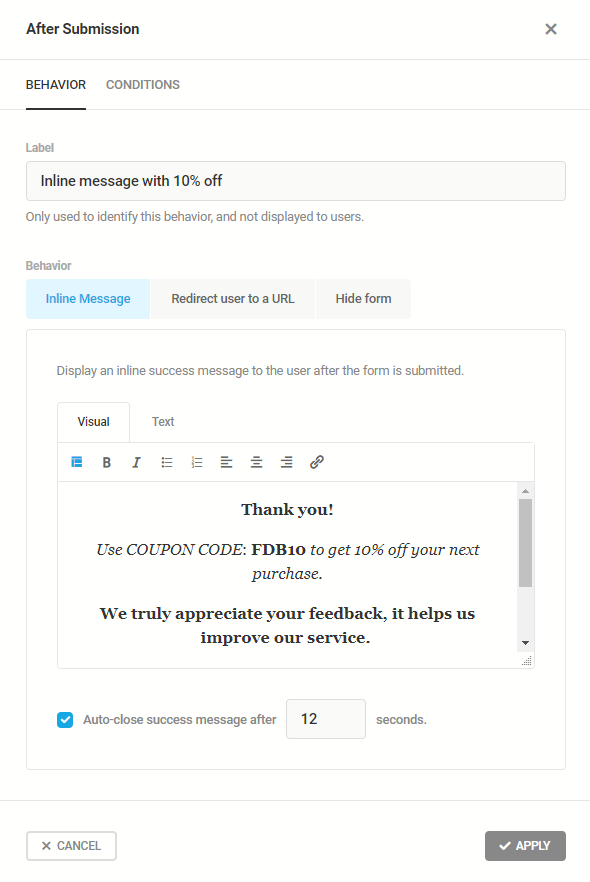
Next, let’s take a look at the Behavior settings:
Here you set what happens after the survey is sent. What is the customer going to see?
You can place a message or you can redirect them to another page.
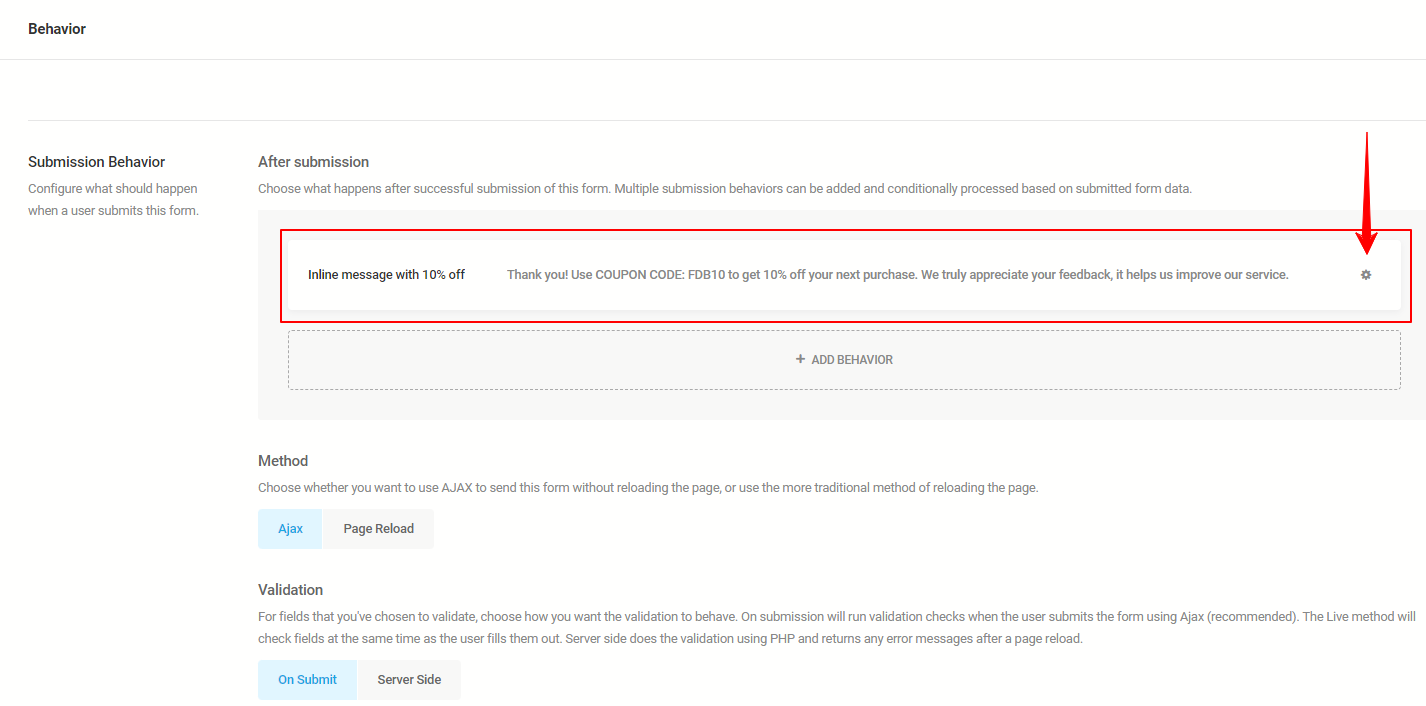
In my example, I offer them a 10% Coupon Code for their next purchase.
You can do your own thing. Don’t forget the conditional logic here, where every answer can have a different result.
Customers can choose their own experience based on the answers they give.
You can also set conditions as to where they may get redirected to a specific page if they have answered a specific question in a specific way.
For example, you can redirect a customer who rated 9 or 10 on the NPS survey, to a different page than the one that rated 0-6.
You get the idea. The sky is the limit.
You can implement a lot of cool ideas with this tool.
It is much more powerful than you can imagine at first.
Next, email notifications. Here you can get notified when a customer completes the survey (or any form).
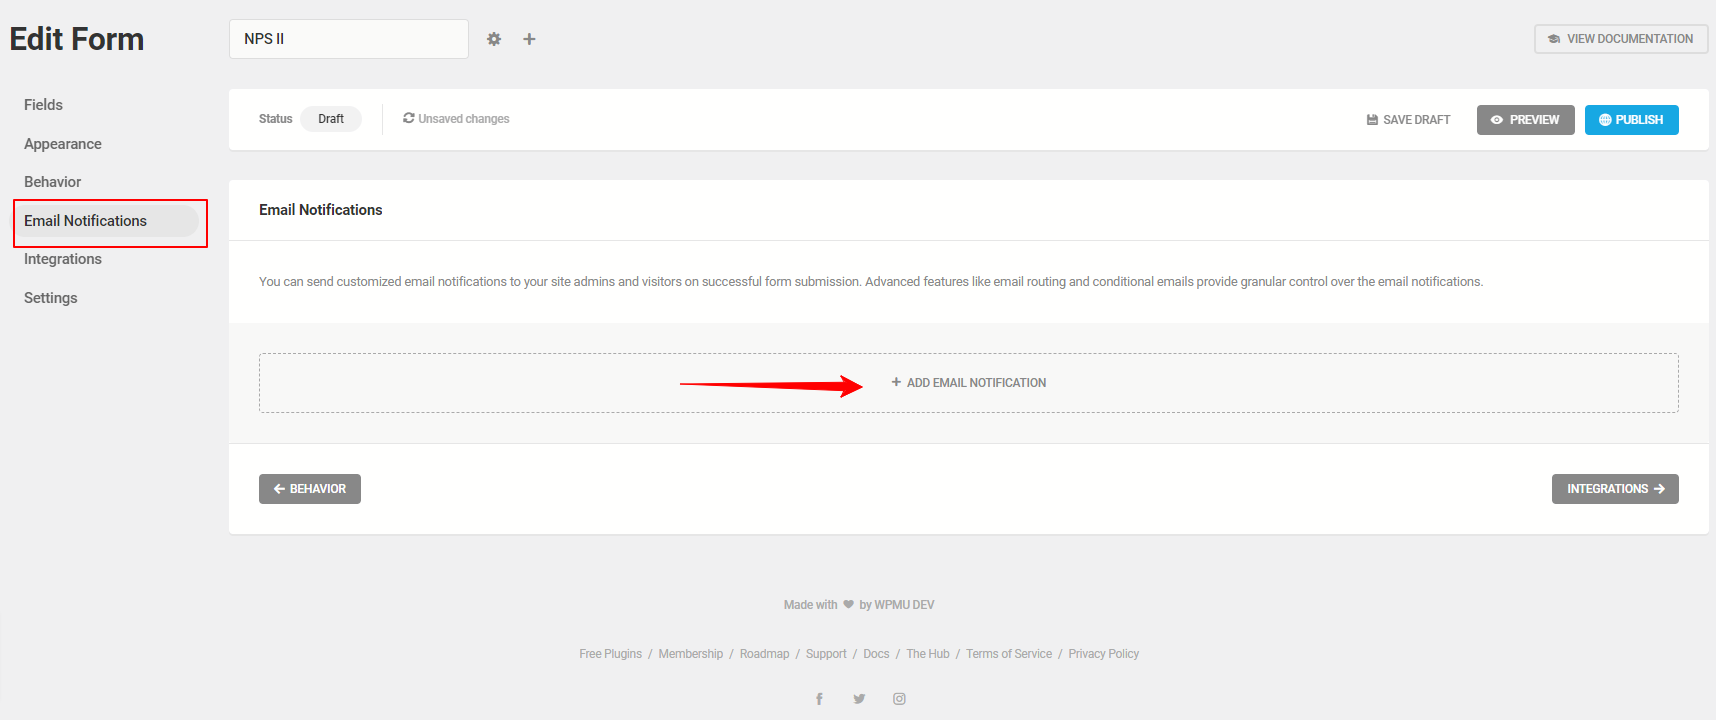
In my case, I left it blank cause I find it distracting.
But you can set a condition to get notified only when a customer rates the NPS survey from 0-6 (is a detractor). Again, take some time to think about it and see what’s best for your interest.
The next tab is Integrations.
You can go through the documentation to learn how to connect with other apps. This is where the tool becomes really powerful.
Finally, you can navigate to the settings tab and see if you want to tweak data storage and privacy settings.
Back to the fields tab to start creating our NPS survey.
NPS Survey
First, let’s see a bird’s eye view of the simple NPS survey form
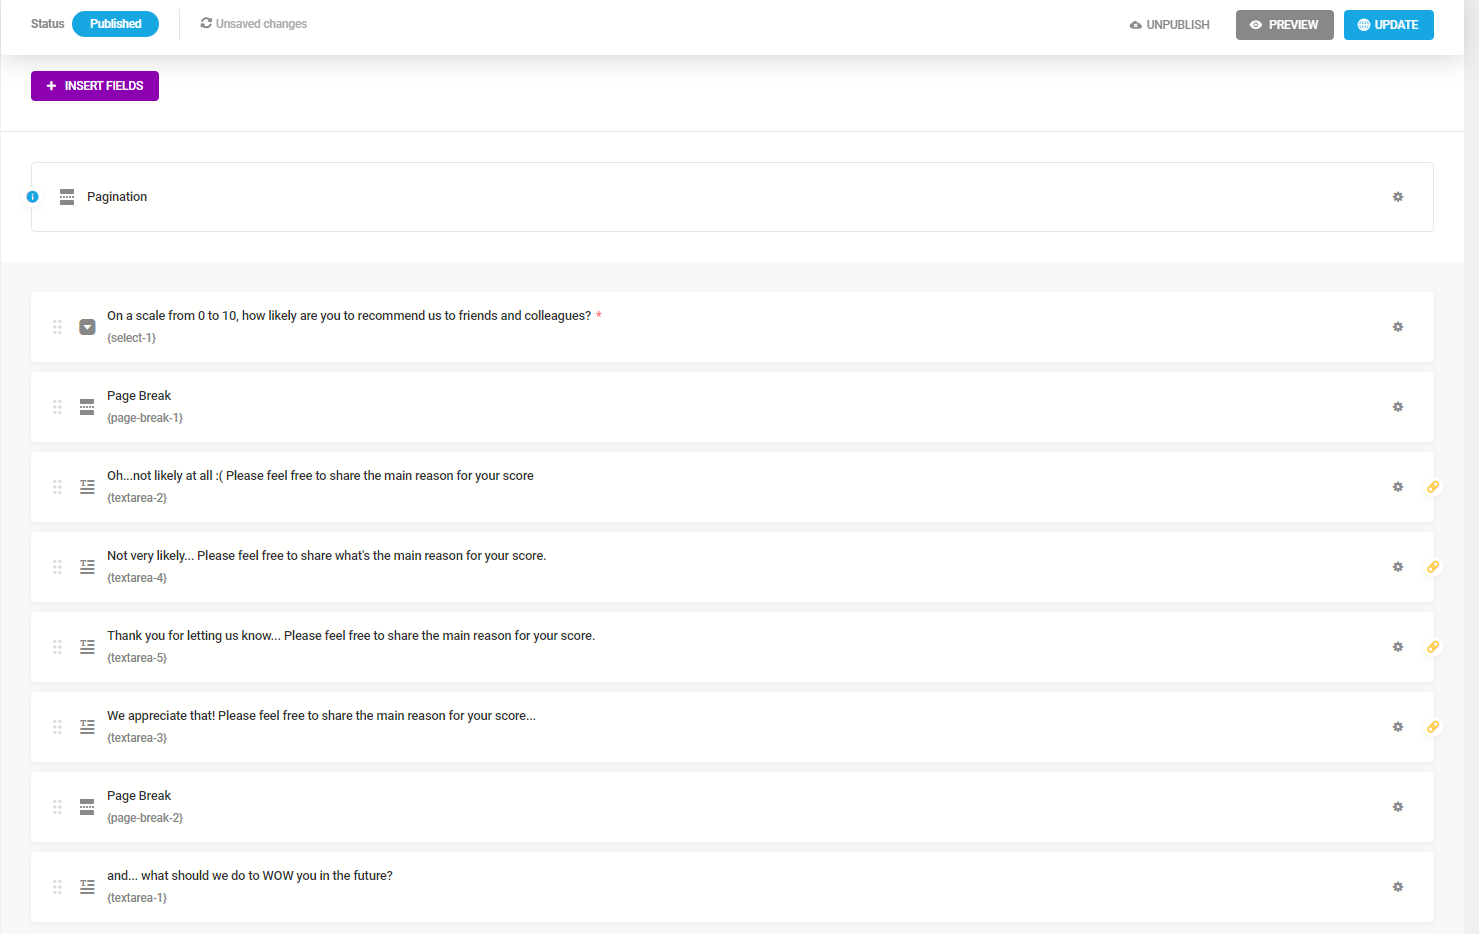
The basic idea for this specific survey is this:
I have grouped the answers into 4 categories. Those who rated 0-2, 3-6, 7-8, and 9-10.
Based on their rating, I have changed the text to express my empathy with a short sentence, to acknowledge their feelings. To make them feel heard in a way.
So all four text area fields that have a yellow link icon on the far right, are just variations of the same answer, based on the ratings my customers will give.
And finally, I have another follow-up question at the end. I was inspired by Hotjar for that question and it is: ‘What we should do to WOW you in the future?’.
I love this open-ended question cause it offers them the opportunity to voice their opinion in their own words. And this feedback is precious.
And now let’s create it step by step:
Step #1
Click on the purple button to insert a new field, and you will come across several options. For our simple NPS survey, we are going to need just three of them:
The ‘Textarea’ (a few of those) fields, the ‘Select’ field, and the ‘Page Break’ field.
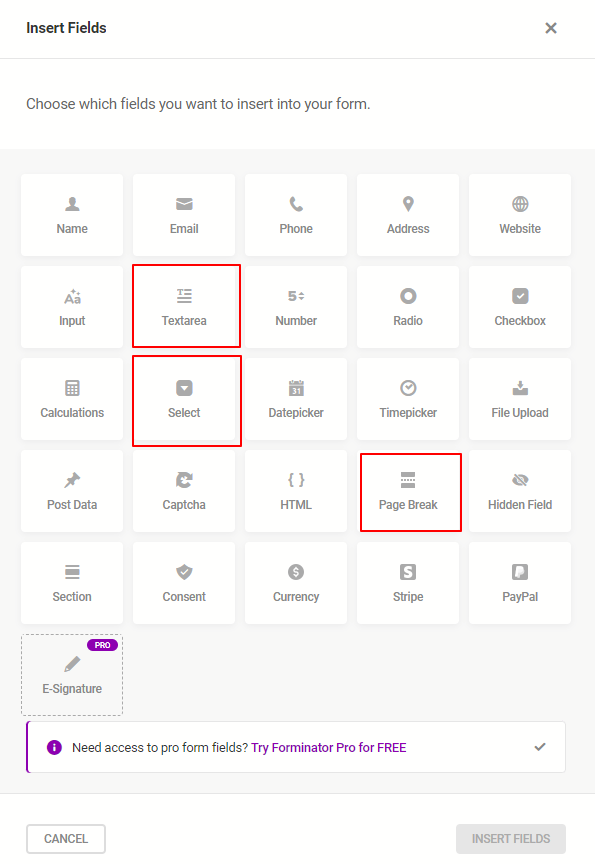
So let’s insert the ‘Select’ input field first to start creating the survey.
This is how it looks when you add it and when you click on it to edit it:
And this is what I’ve done to make it look like it does on the front end.
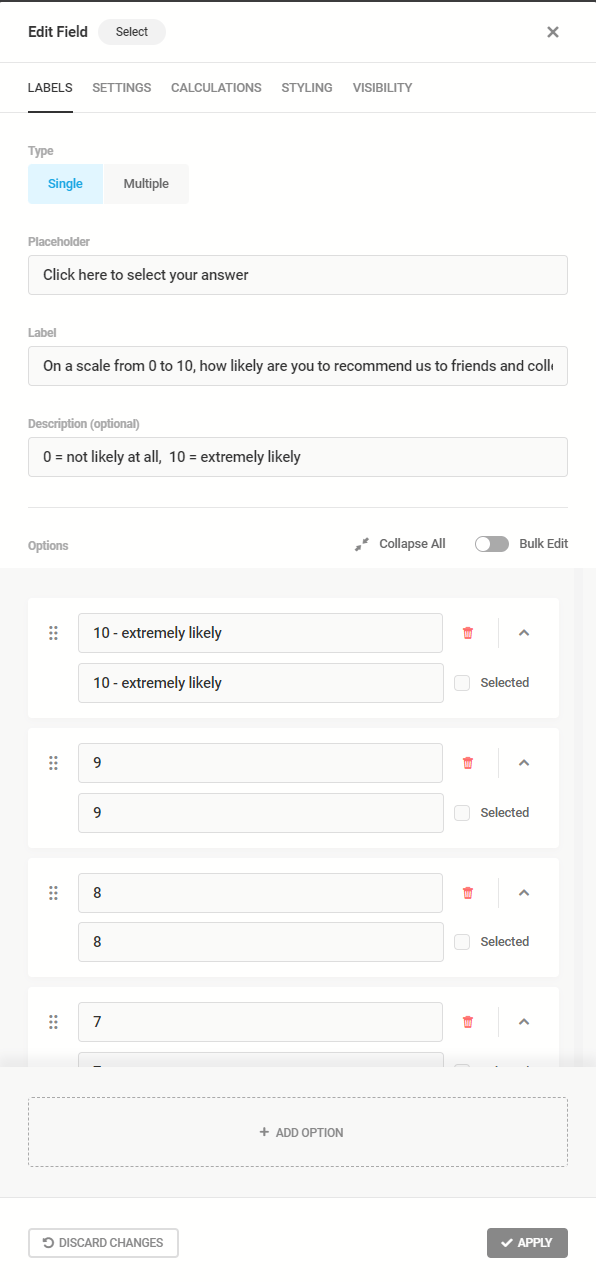
I have added some text and I have created some options.
For the simple NPS survey, I just had to create the options from 0 to 10.
At this point let’s look at the live survey again to understand better what we’re doing here:
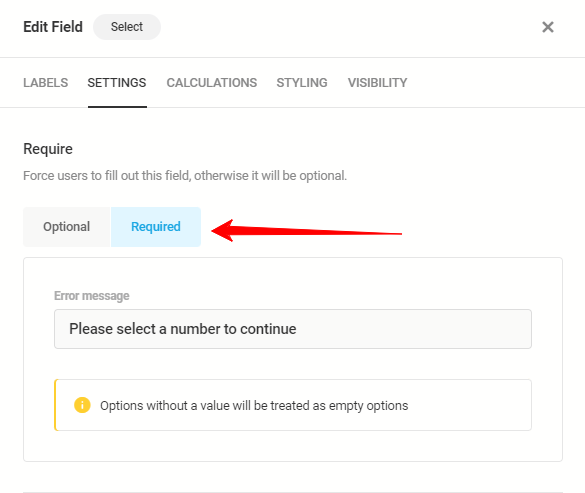
Now on the Settings tab, next to the Labels, I just made the field required and left the other options to the default settings.
Step #2
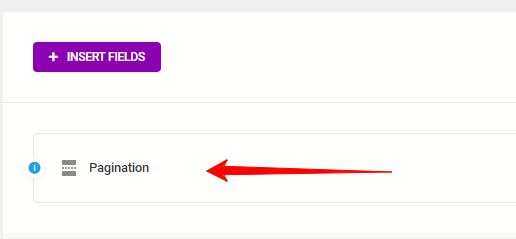
It’s time to add our first Page Break field.
Click on the purple button to insert the new field, choose Page Break from the list and insert it.
Page Breaks are a bit different in their settings than the other fields.
A new bar on the top of all fields is created and this is where you click to change its settings:
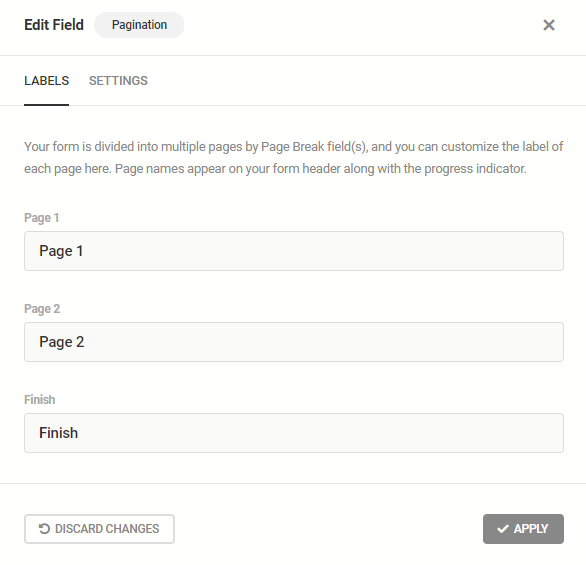
I will share my pagination settings for my NPS survey below:
The settings for my Labels:
The settings for my Progress Bar and Buttons Text:
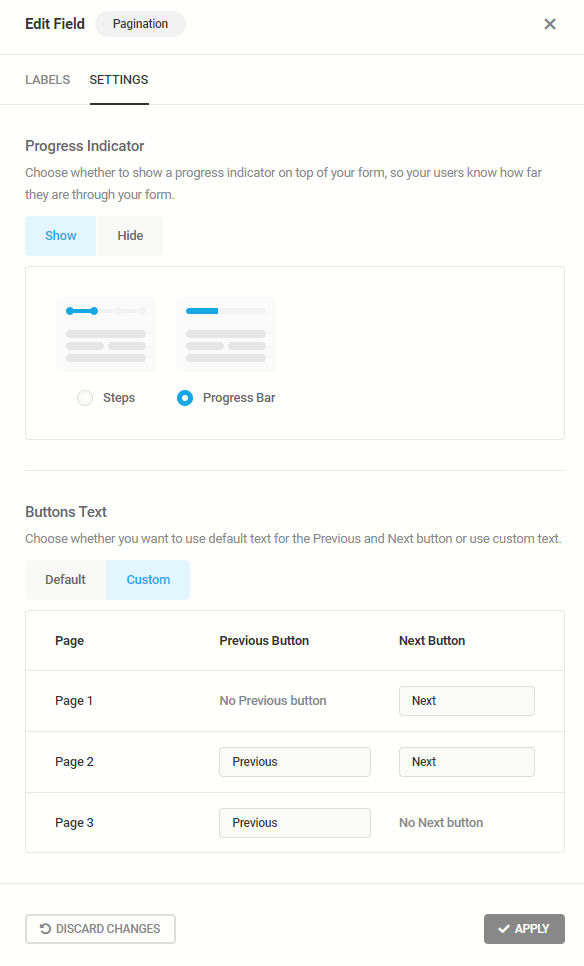
Notice that I have another Page Break in my survey, but the settings are universal for all Page Breaks in this specific form.
Step #3
Let’s add the text fields now with the answers based on the customer’s rating. I’m having four groups of answers (0-2, 3-6, 7-8, and 9-10) so I will create one field first and then I will clone (duplicate) it.
Here’s how it looks for my 0-2 ratings:
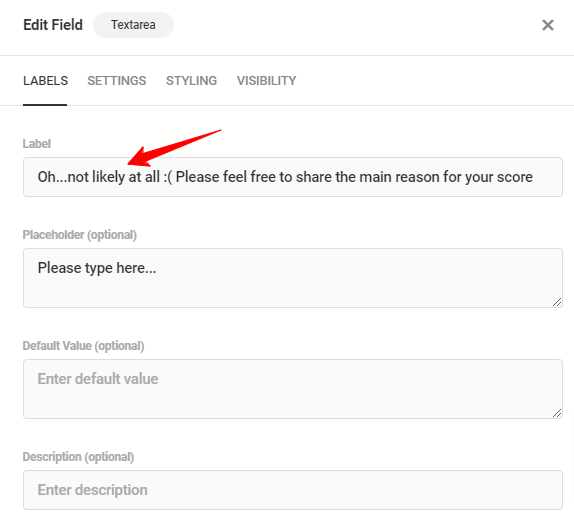
You can check the live survey again to see the rest of the replies:
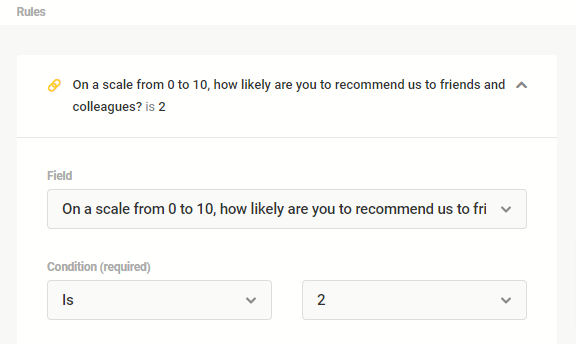
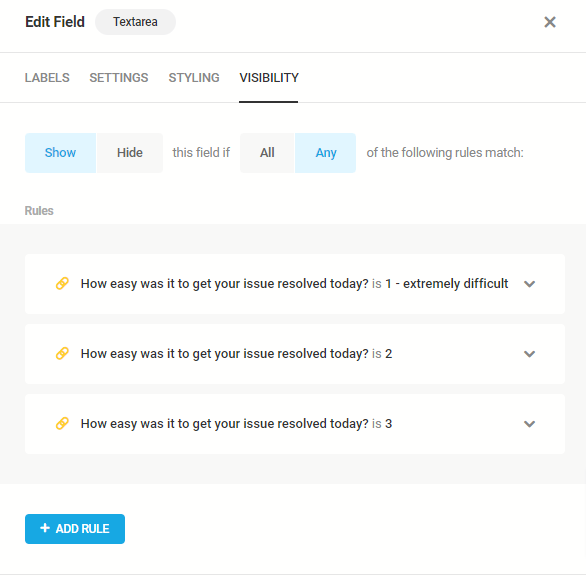
And here’s what the Visibility settings look like for this example:
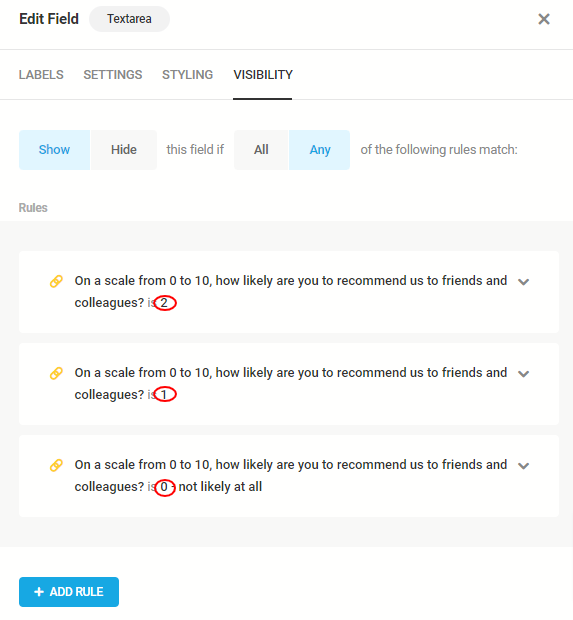
The rule is simple: When a person rates 2, then this specific text area is triggered and shown as the next step of the survey.
Then you add a similar rule for the ratings 0 and 1.
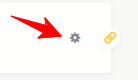
Now that this text area is ready, just duplicate it by clicking the gear on the far right of the field.
Then change the labels to associate the message with the rating they gave and add the rules in visibility. So instead of 0-2, you now change the rules to 3-6.
You save and then you duplicate this text area to create the next one with the same logic.
Then duplicate the Page Break field, and add it after the last text area field.
You end up having four text fields, one select field, and two-page break fields so far.
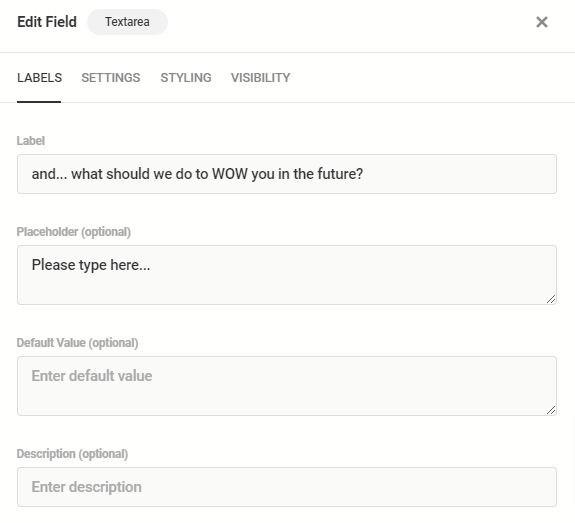
Lastly, you need to create another text area field for your final follow-up question. No rules here, it is shown to everyone that participated in the survey:
I suppose you have already tweaked the message in the Send field, so our form is now ready to go live.
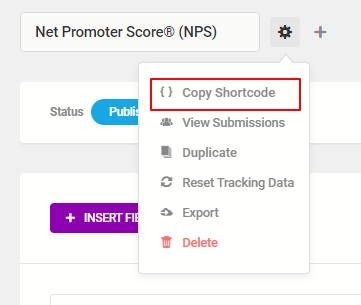
Hit Publish from the top right corner and your survey (form) is now published. You just have to copy the shortcode now and place it on your WordPress page.
Click on the gear next to the form name, to get the shortcode:
That’s it. Your NPS survey is now live and you’ve done most of the job for the rest of your surveys.
Now duplicate your survey/form to create the next one, the CES survey. You do that by clicking the same gear next to the form name as shown in the screenshot above.
CES Survey
You have now duplicated the NPS survey to help you save some time creating your CES survey. Change the name on the top and hit save draft.
The bird’s eye view for this survey looks like this:
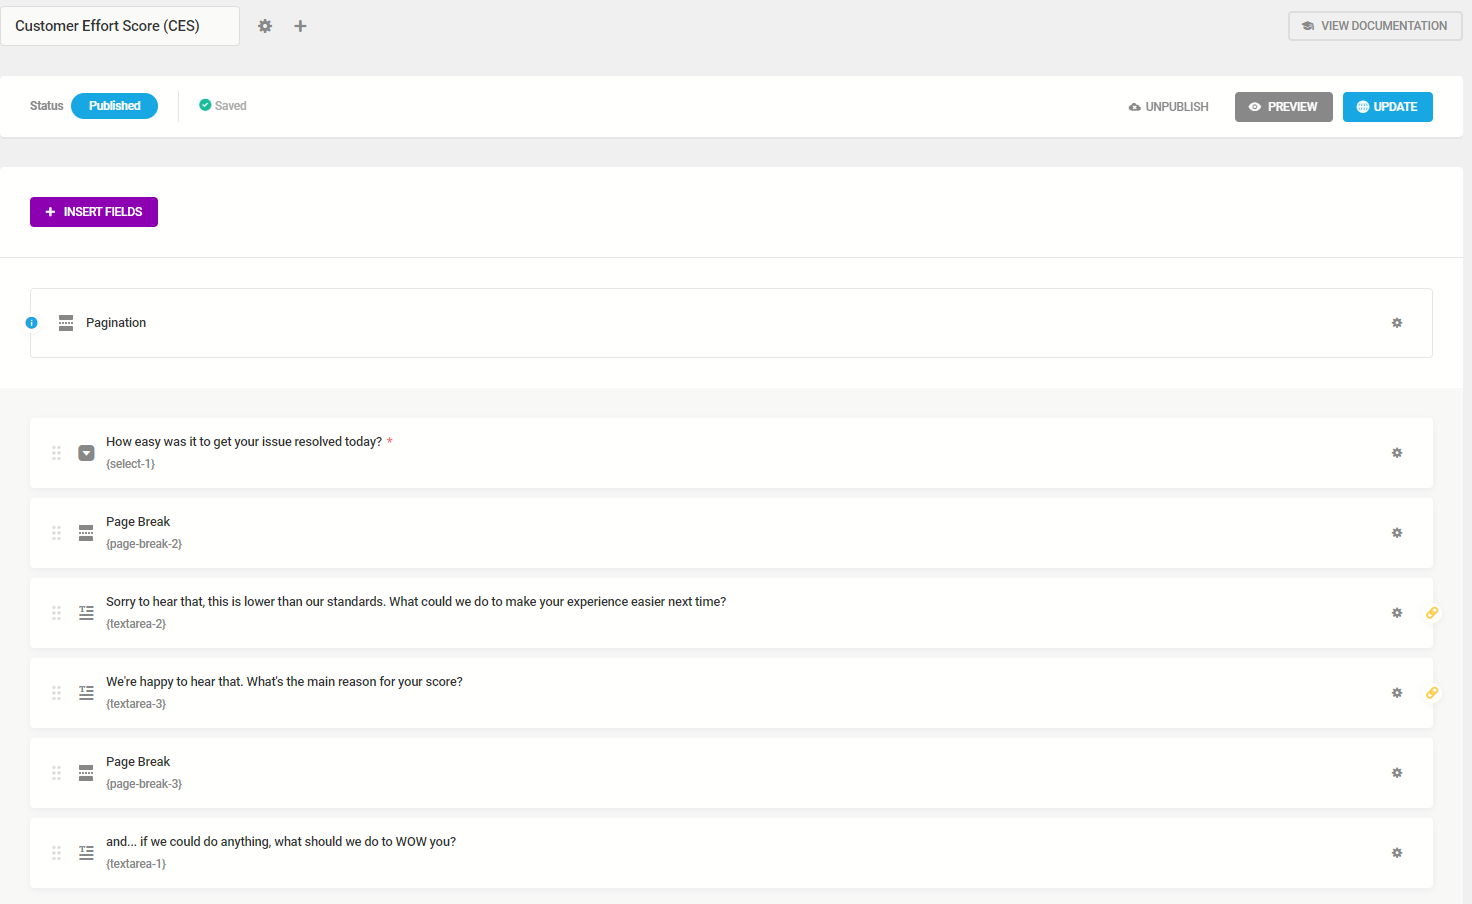
It’s now really and fast to finalize your CES survey.
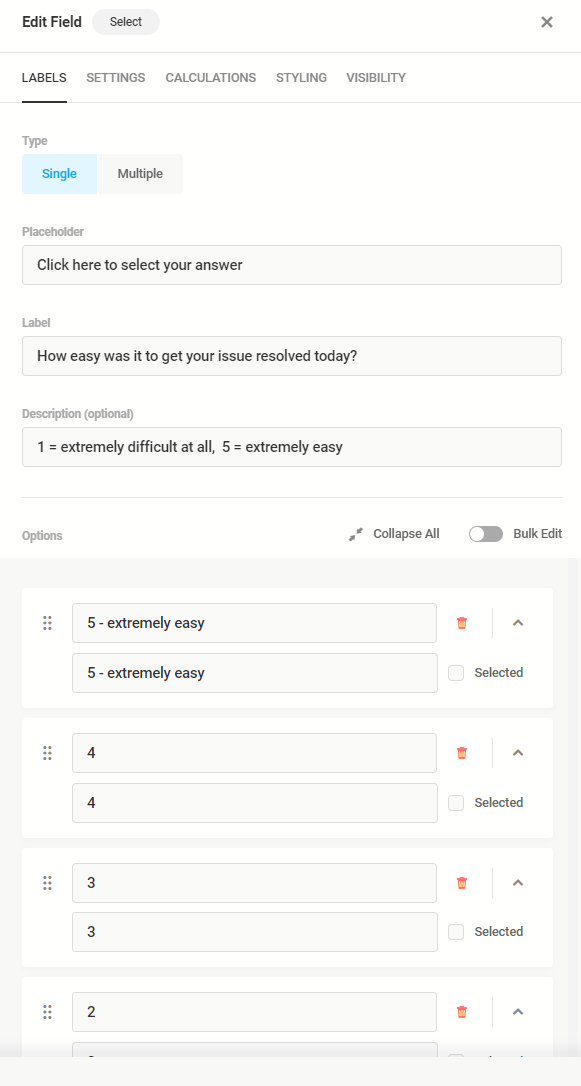
Click on the first field – the Select field – and just change the label, description, and options. You will create 5 options for this survey as you are using the scale 1-5 now.
Then go to the Visibility tab to change the rules. Select your question and the relative answers. In my case, and for this specific survey, I have created just two groups, the 1-3 ratings and the 4-5 ratings.
So I needed only two Text area fields as it is shown in the bird’s eye view screenshot above.
That’s it. Your form is ready. You may need to change other settings like email notifications and set other rules. In my example my simple CES survey is now ready.
CSAT Survey
Now that we have the CES survey ready, we duplicate it to create the CSAT survey.
In this one, you have three groups. One group for the 1-2 ratings, one group for the ratings of 3, and a third group with the 4-5 ratings.
Here’s the bird’s eye view of the CSAT survey:
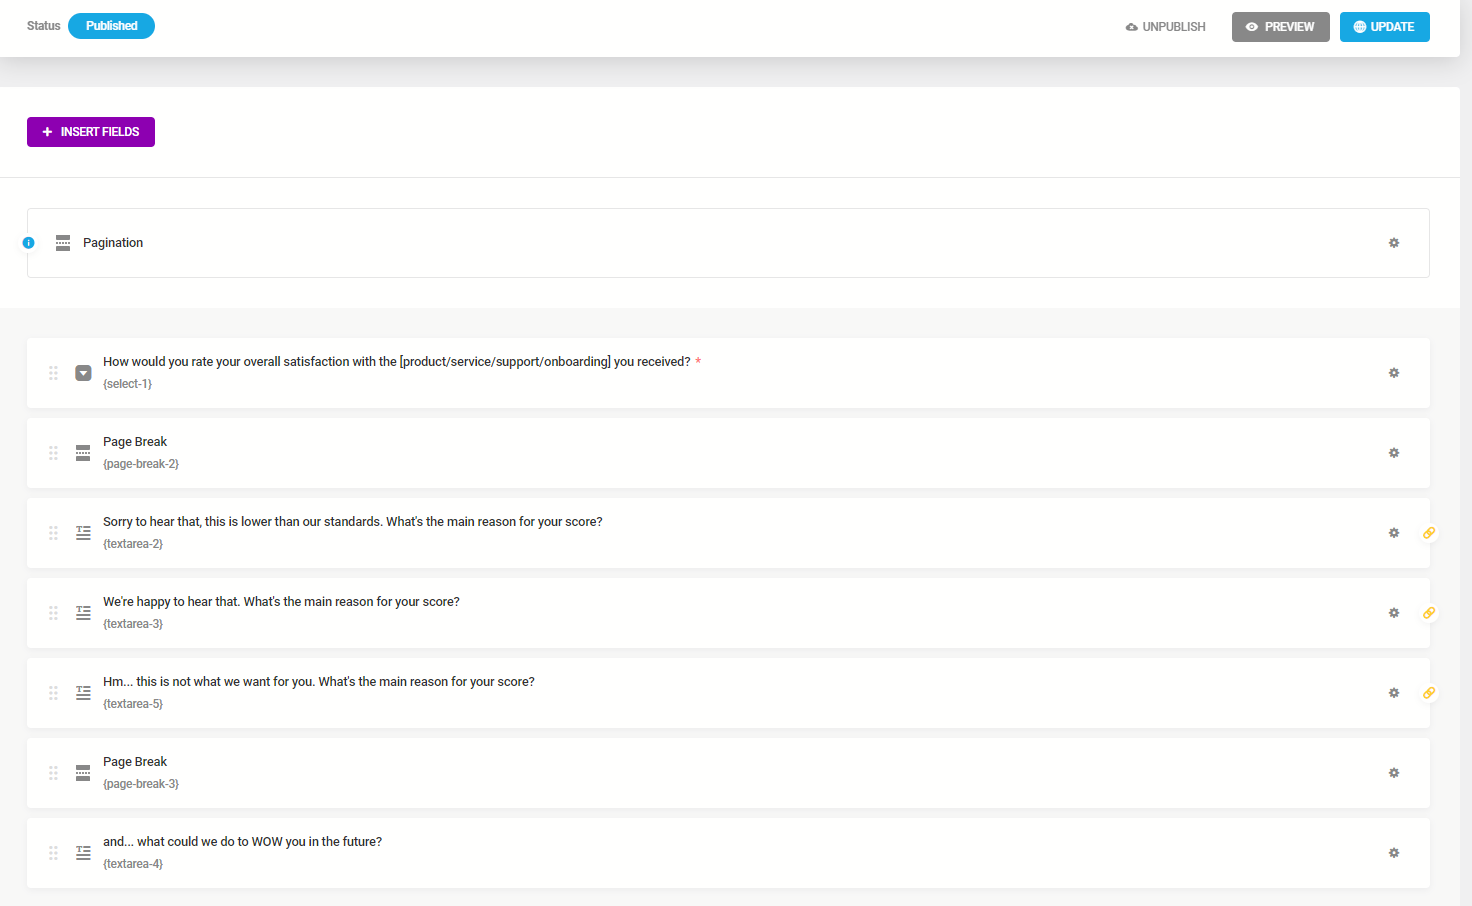
The logic is the same. Edit the first question to reflect the survey objective and change the text area fields, in terms of labels and visibility.
Save ->Publish -> Get Shortcode -> Add Shortcode to page.
Now let’s create the final one, the TTR survey.
TTR Survey
The TTR survey is slightly different than the previous three.
I recommend you duplicate the CSAT survey to save some time with your current settings.
Here’s the bird’s eye view of the TTR survey:
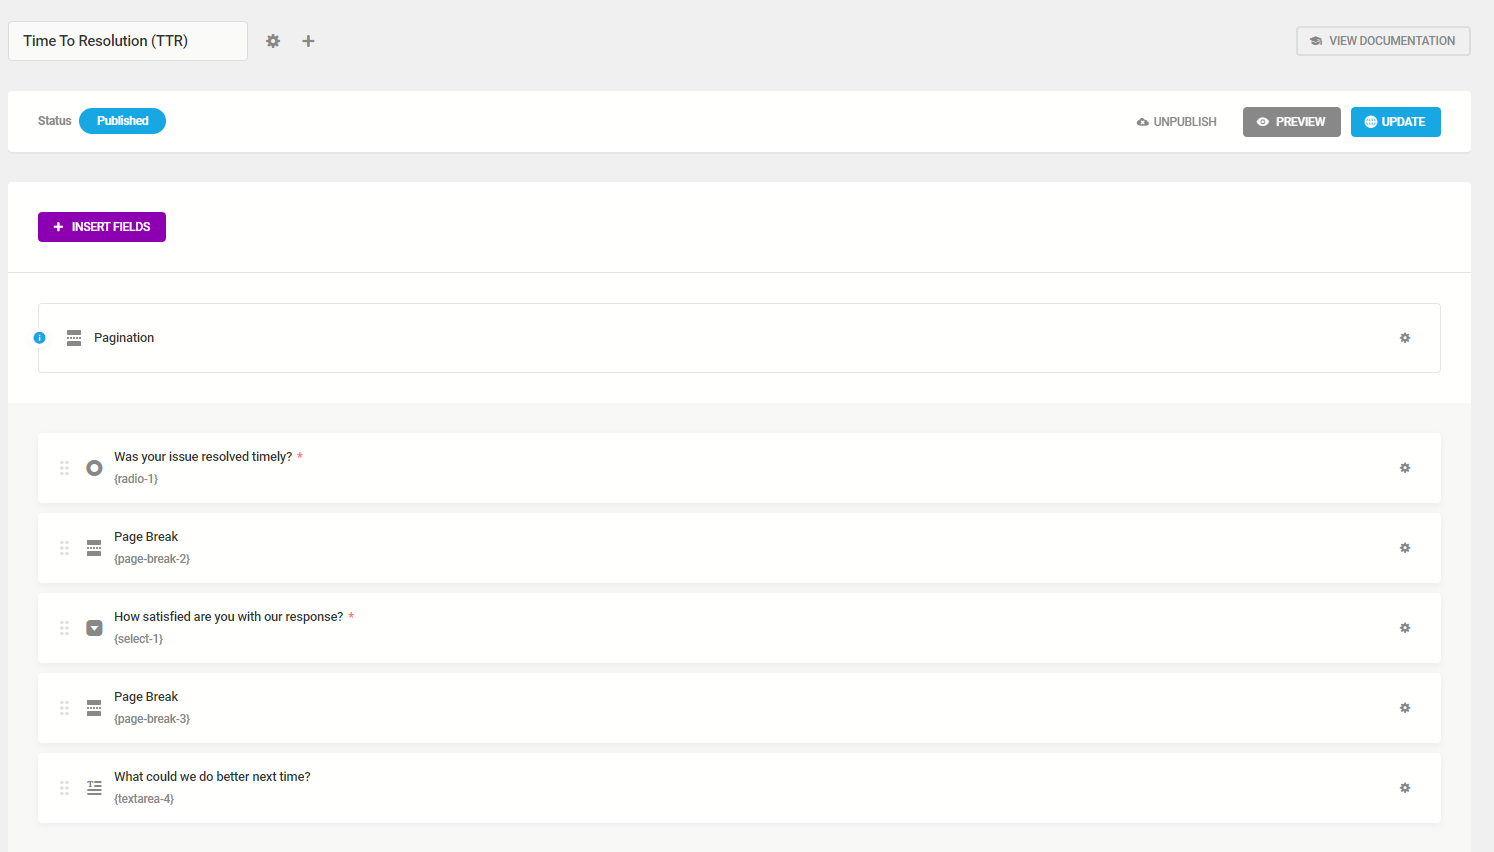
In this survey, we have one ‘radio’ field, one ‘select’ field, two ‘page break’ fields, and a ‘text area’ field.
Here’s the live survey to see how it looks when it’s finalized:
When you see it live, it’s pretty obvious. First is the radio field, then a page break, then a select field, then another page break, and then the text field with the open question.
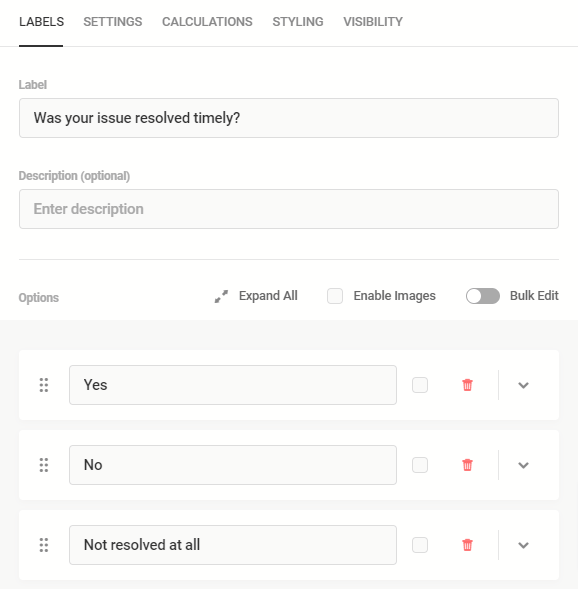
As with the ‘Select’ field, the ‘Radio’ field is pretty straightforward for our simple survey:
After that, you have the ‘Select’ field ready, as you have duplicated the CSAT survey.
Now all you need to do is to edit the last question from the ‘Text area’ field and you’re ready to save and publish.
Save ->Publish -> Get Shortcode -> Add Shortcode to page.
That’s it! Your four CX surveys are now ready to go live.
How to export form data manually
To export the form submissions manually, we need to go to the Submissions tab from the side panel on the left of your WordPress back end.
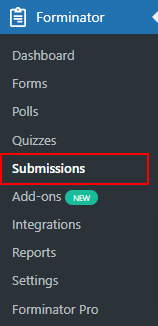
Then we’ll see the screen with the submissions dashboard.
We first need to select the form and then click on the blue button ‘SHOW SUBMISSIONS’
On the top right you will see the button ‘EXPORT’.
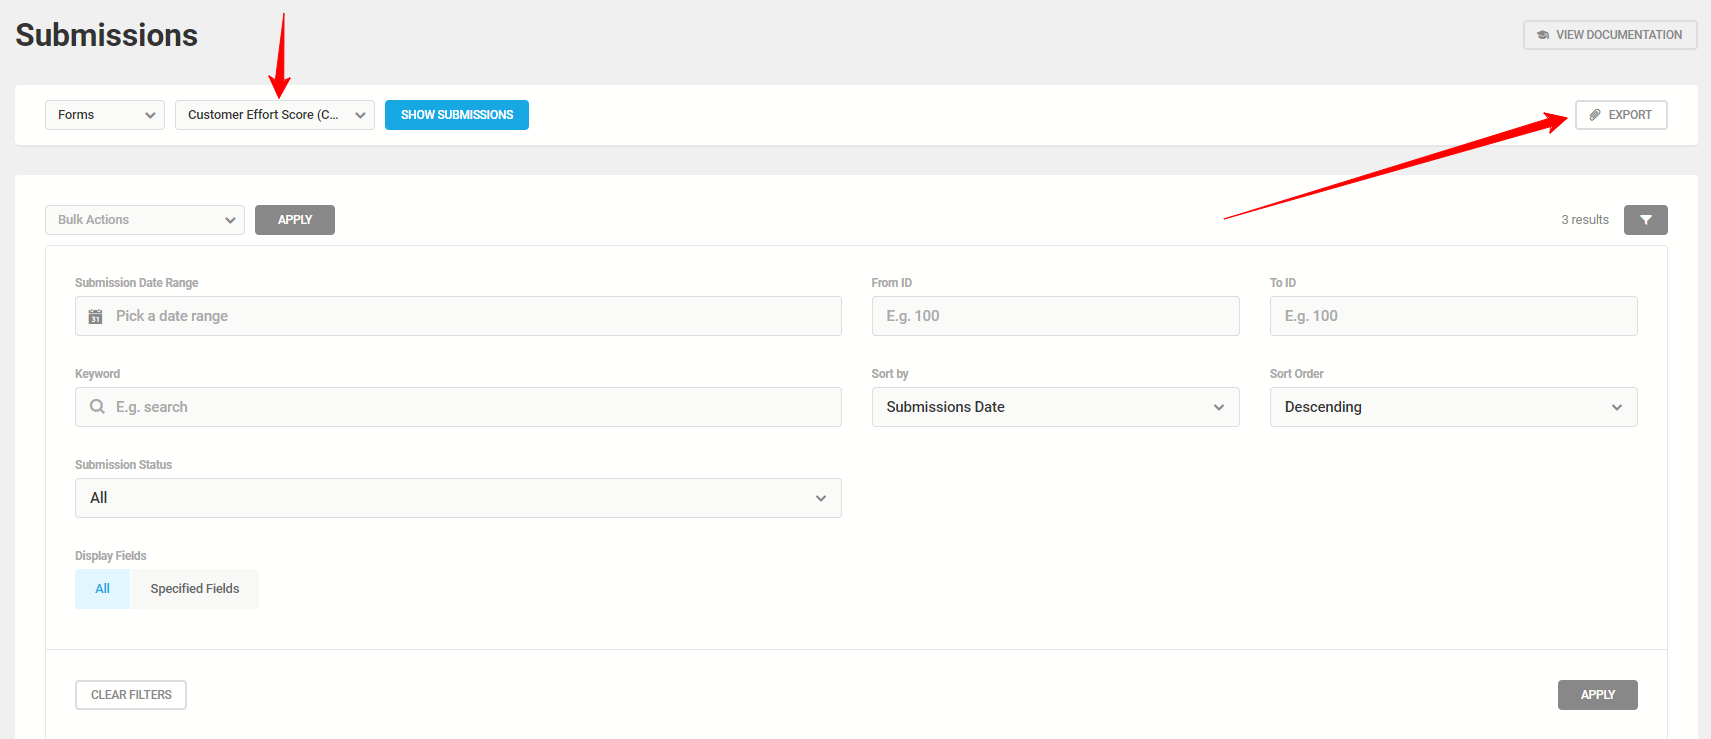
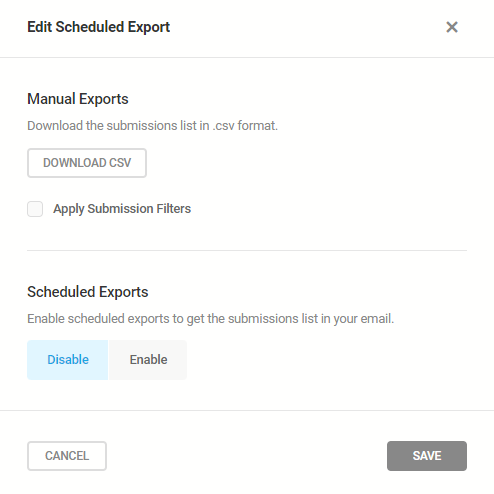
Click on it and you will see the options you have to export a CSV file and/or to schedule an export if you want.
Downloads
To download all four surveys click here to access the Google doc.
To import them one by one, simply copy the code for each survey (one at a time) and follow the instructions below.
How to import the surveys
You can import the forms I shared in seconds.
Go to Forms and you will notice the IMPORT grey button next to CREATE.
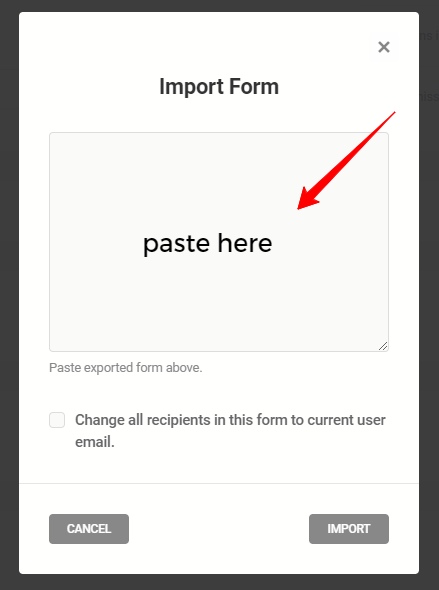
Click on IMPORT.

A new pop-up now offers the opportunity to import a form.
For each form separately, paste the code in the box provided. That’s it!
Data manipulation
There are numerous ways to analyze the results of the surveys and create stories from the data.
I recommend you export the data to a Google Sheet and then create visuals in Google Data Studio.
Or if you work with Microsoft’s Ecosystem you may want to export the CSV to file and edit it in Excel.
This is a topic for a future tutorial/guide.
Would you like to know how to do this?
Let me know in the comments below.
CX matters and Forminator makes it easy
You’re now ready to tweak and use the CX surveys you’ve tested above. I hope you like them.
If you need help with this go here and check the documentation for importing forms.
This is it.
I hope you enjoyed this tutorial as much as I enjoyed creating it 🙂
Was it helpful? Did you create the surveys?
Do you have any other recommendations?
Feel free to share your thoughts in the comments below.